Monitor Client
The monitor client is useful for monitoring the state of a running Shardus network at a glance. Each of the colored circles surrounding the perimeter of the large circle represents a node. There are 3 colors for representing a node's status:
-
greenindicates that the node is active and validating transactions in the network. -
yellowindicates that a node is syncing with the network. -
greyindicates that a node has submitted a join request and is waiting for its request to be accepted, so it can start the syncing process.
Hovering over a node will reveal a list of properties that are held by each node:
nodeId indicates that node's ID
marker indicates the cycle marker seen by that node
state indicates the hash value for the color of a node's state (this is green if everything looks OK and red otherwise)
nodeList indicates the hash of the node list of this node
ExtIp displays the node's IP address
ExtPort displays the node's port
TxInjected indicates the current rate of injected transactions seen by this node
TxApplied indicates the current rate of applied transactions seen by this node
TxRejected indicates the current rate of rejected transactions seen by this node
TxExpired indicates the current rate of expired transactions seen by this node
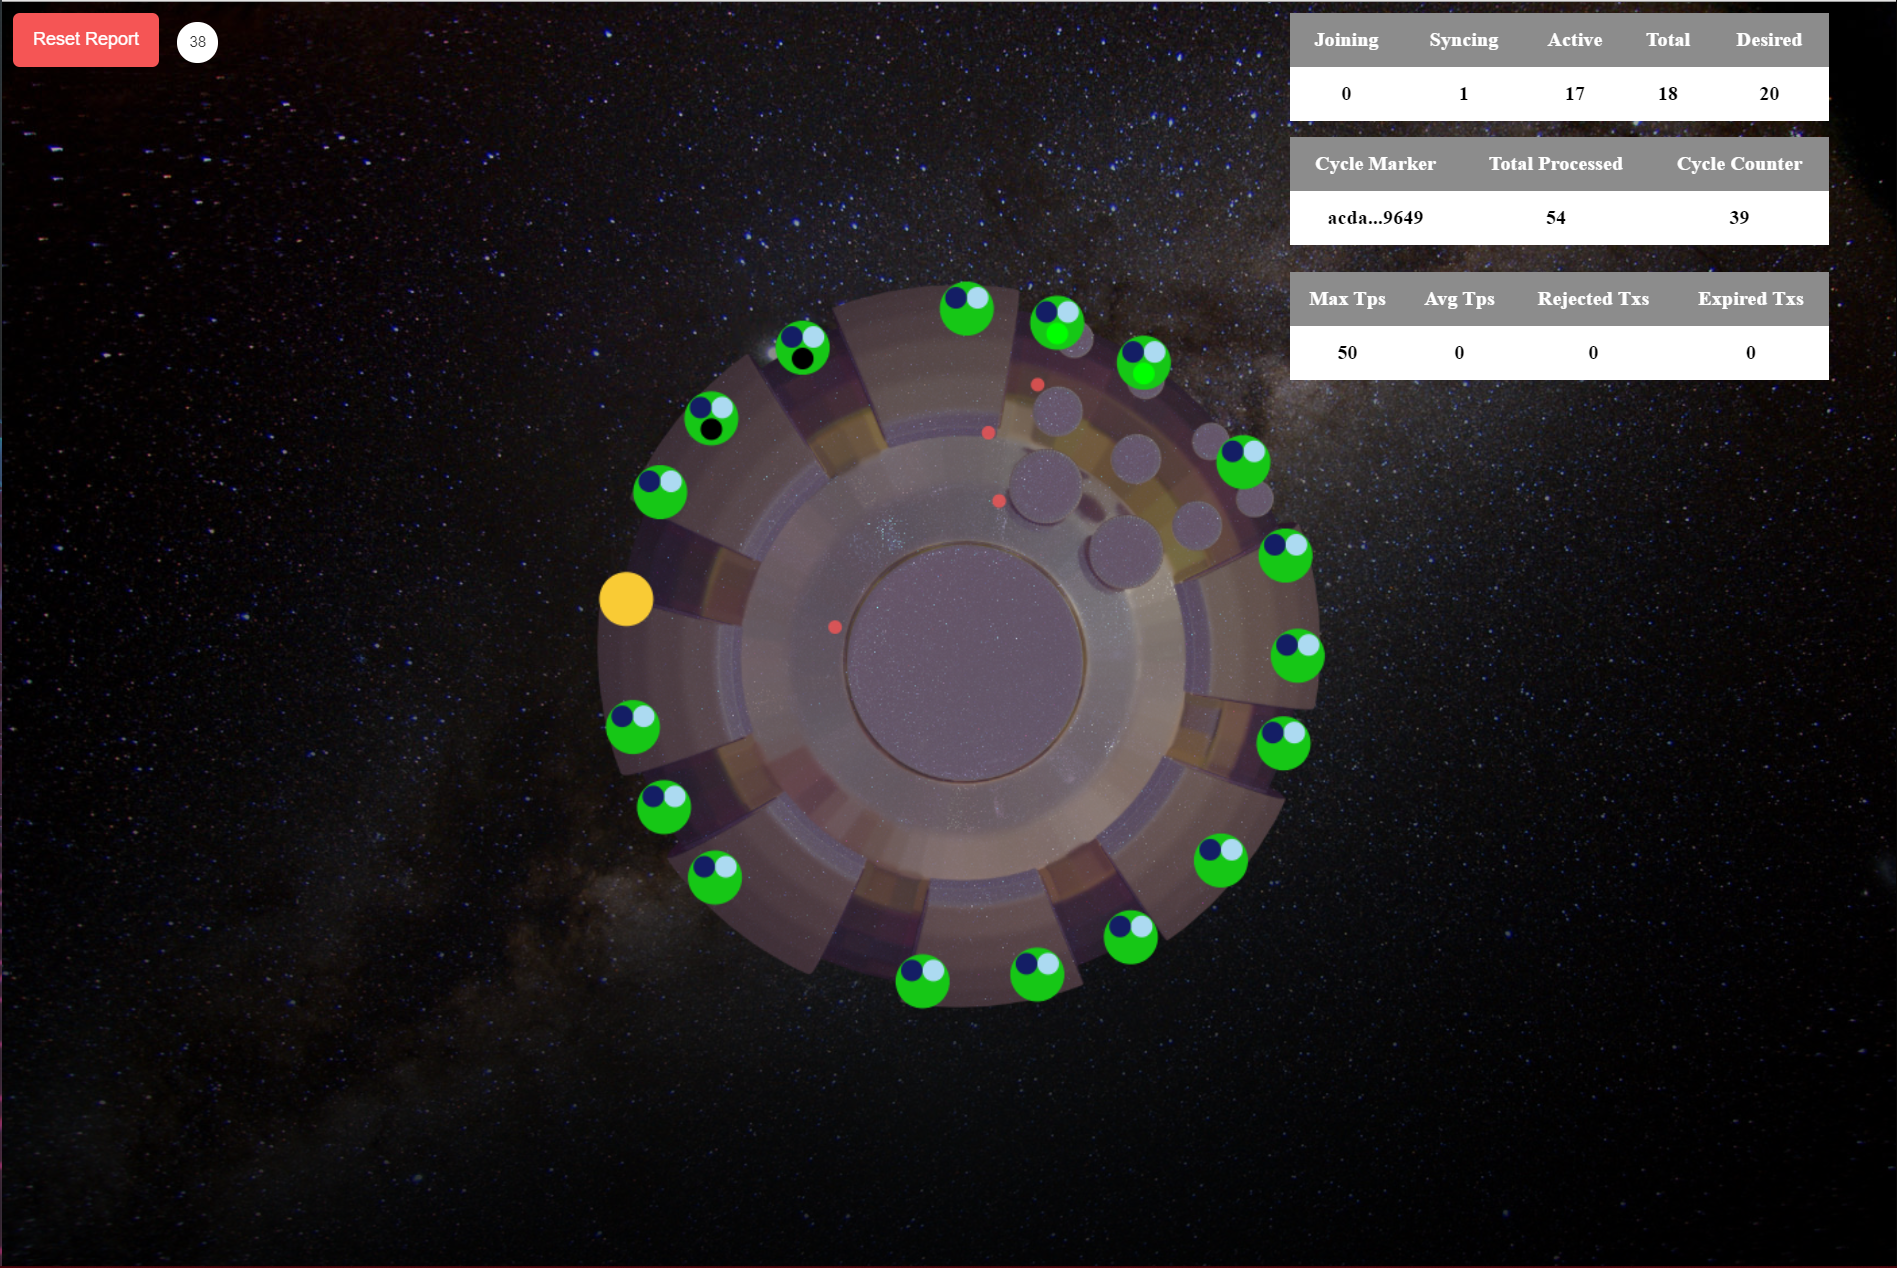
In the top right corner of the monitor client, you can see stats for the overall network performance of your application.